
How to Read a Greyhound Racecard — Form, Traps & Stats
Loading...
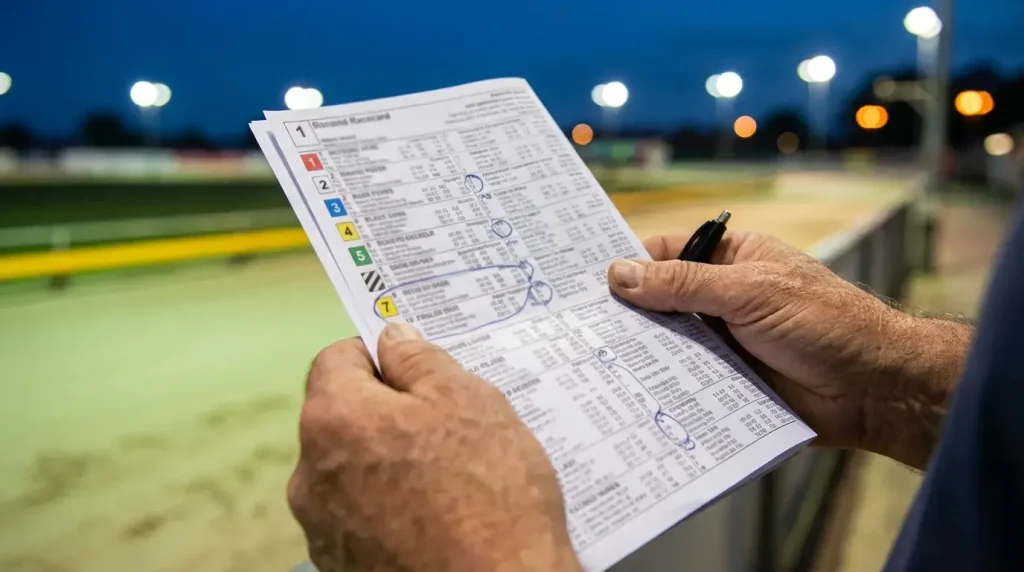
The Racecard Is Your Pre-Race Briefing
Every greyhound race gives you the same data set. The difference is whether you read it or scan it. Most punters glance at a racecard the way someone checks a restaurant menu — they look for something familiar, pick it, and hope for the best. That approach works for dinner. It does not work when money is on the line.
A greyhound racecard is a compressed intelligence file. In a few lines of text and numbers, it tells you the race distance, the grade, the trap draw, recent finishing positions, sectional times, the trainer, the dog’s weight, and in many cases a brief comment from the racing manager. All of that information is published before every single race at every GBGB-licensed track in the country, usually available from mid-morning on the day of the meeting. It is free, it is comprehensive, and it is routinely ignored by people who then wonder why their forecast didn’t land.
The racecard does not predict winners. Nothing does. But it gives you the raw material to form a view that is better than guesswork, and significantly better than backing the dog with the best name or the lowest price. Reading a racecard properly takes a couple of minutes per race once you know what you are looking at — and those minutes are the most productive thing you will do before placing a bet.
This guide breaks the greyhound racecard into its components, explains what each element tells you, and shows you how to assemble those pieces into a working assessment. Whether you are studying an A1 graded race at Nottingham or a D4 sprint at Romford, the card follows the same structure. Learn the structure once, and you can read any card at any track.
What’s On a Greyhound Racecard — Section by Section
Headers first, details second — here’s the order that matters. A racecard is laid out in a specific hierarchy, and understanding that hierarchy means you never waste time reading the wrong thing first. Every card is divided into individual races, and each race block contains two layers: the race header at the top and the runner details below it. The header sets the context. The runner details fill in the picture.
Different racecard providers — Timeform, Sporting Life, Racing Post, At The Races — arrange these elements slightly differently, but the underlying data is identical. Once you can read one provider’s layout, you can read them all. The data comes from the same source: the official GBGB returns filed by each track after every meeting.
Race Header — Time, Distance, Grade
The header tells you what kind of race this is before you look at a single dog. It contains the race time (when the traps open), the distance in metres, and the grade. These three facts immediately narrow the field of analysis.
Distance matters because greyhounds are specialists. A dog that excels over 480 metres at Monmore may have no business running 640 metres at Nottingham. The grade — expressed as a letter-number combination like A3, A7, or D2 — tells you the quality band. A1 is the top tier of standard graded racing; A11 sits at the bottom. D-grades are sprint distances, typically 230 to 280 metres depending on the track. The higher the number, the lower the class.
You will also see whether the race is graded, open, or a handicap. Graded races are the bread and butter of a meeting — dogs grouped by demonstrated ability. Open races draw from a wider pool and carry more prestige. Handicaps stagger the starting positions, which changes the trap-draw dynamic entirely. Knowing the race type before you assess individual runners is essential, because a dog’s form in graded company may not translate to an open or handicap event.
Runner Information — Name, Trainer, Form
Every dog gets one line. That line contains six months of story. Below the race header, each runner is listed by trap number, and the information typically runs in this order: trap number and colour, dog name, trainer, recent form figures, best time at the distance, sectional time, weight, and in some cases a short comment from the racing manager or analyst.
The trap number is not just a starting position — it determines which colour jacket the dog wears and where it stands in the boxes. Trap 1 is red, always on the inside rail. Trap 6 is black and stripes, always on the outside. The trap assignment is published in advance and does not change, so when you see a dog listed in trap 4, you know it will break from the blue box and take a middle-to-wide line into the first bend.
The trainer name may seem like filler, but it is not. Certain kennels have strong records at specific tracks. A trainer who sends dogs to Romford every week knows that circuit better than one who enters a runner there once a month. Trainer form — the percentage of winners from recent runners — is published by Timeform and is worth checking, particularly when two dogs in the same race look evenly matched on paper.
Recent form figures are the heart of the card. They appear as a string of numbers — something like 211432 — representing the dog’s finishing positions in its last six races, reading left to right from most recent to oldest. We will break these down in detail in the next section, but at a glance, lower numbers are better, and the sequence tells you whether the dog is trending up or sliding back.
How to Read Greyhound Form Lines
A string of digits that reads like a code — because it is one. The form line is the most information-dense element on a greyhound racecard, and it rewards careful reading more than any other data point. Unlike horse racing, where form figures can span years of races across dozens of courses, greyhound form is compressed. Dogs race frequently — often weekly — and the standard form line covers the last six outings. That recency makes the data fresh but also volatile. A dog’s form can shift dramatically in three weeks.
The numbers represent finishing positions. A line reading 111234 shows a dog that won its first three recorded races, then faded to second, third, and fourth in subsequent outings. Read left to right, newest to oldest — though some providers reverse this, so check the format on your preferred racecard source before drawing conclusions from the wrong end of the sequence.
Beyond the raw positions, many racecards include additional codes. The letter “T” denotes a trial run, not a competitive race. An “m” or “M” might indicate the dog was brought down or met interference. A dash or hyphen typically means no recent run. These qualifiers change the meaning of the line significantly. A form figure of 1m1211 is not the same as 161211 — the “m” tells you the dog was impeded in that run and the finishing position does not reflect its true ability on the night.
Position Numbers, Traps, and Run Comments
1 means first, 6 means last — the middle numbers are where the value lives. A dog that consistently finishes second or third is not a loser; it is a dog that keeps finding the frame without quite getting its head in front. In forecast betting, that kind of reliability is gold. The punters who only back winners miss this entirely.
Most detailed racecards show not just the finishing position but also the trap the dog ran from in each previous race. This matters. A dog showing a form line of 332241 might look steady, but if those thirds came from trap 6 at a track with a pronounced inside bias, the picture changes. That dog was running against the draw and still finishing close up. Move it to trap 1 or 2 at the same track and the form becomes significantly more impressive.
Run comments, where available, add context that numbers alone cannot provide. A comment like “led to third bend, crowded on bend” tells you the dog had the pace to lead but was physically hampered. “Slow away, ran on” suggests a dog that broke poorly but showed strong finishing speed — useful information if you are assessing whether it can win from a better start. Timeform’s racecard comments are among the most detailed in the industry, and reading them takes seconds. They are not opinions about whether the dog will win next time; they are factual descriptions of what happened last time.
When assessing form, always cross-reference the position with the trap and the comment. A bare finishing position is a fact. Combined with the trap draw and the run narrative, it becomes evidence.
Spotting Improving and Declining Form
Consistency matters more than a single brilliant run. A dog with a form line of 333221 is telling you a clear story: it has been gradually improving, moving from the middle of the pack towards the front. That upward trend is more bankable than a dog showing 162151, which won once but has been erratic either side of that victory.
Look for patterns rather than peaks. Three consecutive seconds followed by a first suggests a dog that was knocking on the door and finally broke through. Three consecutive firsts followed by a third might mean the dog has been raised in grade and is now finding the company too strong — or it might mean it had one bad night. The context around the numbers determines which interpretation holds.
Declining form is harder to diagnose because it can stem from multiple causes. A dog that goes from 112 to 345 over three races might be carrying a minor injury, might have been moved up in class, or might simply be past its peak racing age. Check the grade of each race in the form sequence. If the grades have been rising (A5 to A3 to A2), the declining positions are expected — the dog is meeting better opposition. If the grades have stayed the same and the positions are falling, that is a genuine warning sign.
Weight changes alongside form shifts can confirm or deny your suspicion. A dog losing half a kilogram over three races while its form drops is worth monitoring closely — the weight loss might indicate a fitness issue. A dog gaining weight slightly while maintaining or improving form is typically in good condition and carrying race fitness well.
The Trap Draw — Colour Codes and Tactical Meaning
Six traps, six colours, six different angles into the first bend. The trap draw in greyhound racing is not a cosmetic detail — it is a tactical variable that affects race outcomes more than most casual bettors realise. Every UK greyhound race uses a standardised colour system: trap 1 is red, trap 2 is blue, trap 3 is white, trap 4 is black, trap 5 is orange, and trap 6 is black and white stripes. These colours are universal across all GBGB-licensed tracks, as defined in GBGB Rule 118, so once you know them, you know them everywhere.
The reason the trap draw matters is geometry. Greyhound tracks are oval circuits, and the first bend comes quickly — usually within the first 50 to 80 metres of a race. Dogs breaking from trap 1 have the shortest route to the rail and the tightest line into the bend. Dogs from trap 6 have to cover more ground to reach the same point, but they also have more room to manoeuvre and less risk of being boxed in by traffic on their inside.
Different tracks produce different trap biases, and those biases are measurable. At some circuits, trap 1 has a statistically significant advantage in races over standard distances because the first bend is sharp and close to the boxes. At others, the wider traps perform better because the run to the bend is longer, giving outside dogs time to find a racing line without being squeezed. These biases are not fixed — they shift with track conditions, weather, and the grading of individual races — but long-term trap statistics published by services like Timeform and the GBGB results service give you a baseline.
A practical approach is to check the trap stats for the specific track and distance before assessing form. If trap 1 at Romford over 400 metres wins 22% of races against a fair-share expectation of roughly 17%, that is a meaningful edge for any dog drawn inside. Conversely, if trap 6 at the same track and distance wins only 11% of the time, a dog drawn wide needs to have significantly superior form to overcome the positional disadvantage.
The interplay between trap draw and running style adds another layer. A dog that is a known front-runner — one that leads from the boxes and needs the rail early — gains more from a low trap draw than a dog that typically settles behind the pace and finishes fast. The racecard does not always state running style explicitly, but you can infer it from sectional times and run comments. A dog whose early split is consistently fast relative to its finishing time is a pace dog. A dog with slower early sections but strong run-in times is a closer. Match the style to the draw, and you have a more accurate picture than either factor gives you alone.
Sectional Times — The Data Layer Most Bettors Miss
Finishing time tells you who won. Sectional times tell you why. A greyhound’s overall race time is the headline number, but it hides the shape of the performance. Two dogs can clock identical finishing times and run completely different races — one leading from the traps and hanging on, the other breaking slowly and storming home. Sectional data separates these two performances and reveals which dog has more room to improve.
Sectional times typically measure how quickly a dog reaches the first bend and how fast it covers the run-in (the final straight). The first-bend time, sometimes called the split or sectional, is the more valuable of the two. It tells you whether a dog has early pace — the ability to break sharply and reach the bend in a leading or close-up position. In six-dog fields on tight circuits, the first bend often determines the finishing order. Dogs that reach it first have clean air; dogs that arrive late face traffic.
Where most bettors go wrong with sectional times is treating them in isolation. A first-bend split of 4.10 seconds means one thing at Monmore, where the run to the bend is roughly 90 metres, and something different at Towcester, where the geometry is completely different. Sectional times must be compared within the same track and the same distance. Cross-track comparisons are misleading at best and useless at worst.
The more revealing use of sectional data is internal comparison: how does this dog’s early split today compare with its early split last week? If a dog clocked 4.15 to the first bend in its last three runs and today it posts 4.08, something has changed. It might be the draw, the going, or a genuinely improved performance. Combine that change with the trap allocation and the competition level, and you start to build a picture that raw form figures alone would not give you.
Sectional times are available on Timeform, and some tracks publish their own split data through the GBGB results service. Not every card includes them, particularly for lower-grade meetings, but when they are available, they are the closest thing to a hidden edge that the standard racecard offers. The majority of punters do not check them. That is precisely why they are useful.
Putting It All Together — A Working Method
Here’s a five-step process that takes two minutes per race. It is not a system — systems imply guaranteed outcomes, and there are none in greyhound racing. This is a method for turning racecard data into an informed opinion, which is the only honest foundation for a bet.
Step one: read the race header. Note the distance, grade, and race type. This tells you the context. A 480-metre A3 graded race at Monmore is a different proposition from a 400-metre D2 sprint at Crayford, and your assessment framework should adjust accordingly.
Step two: check the trap statistics for this track and distance. You do not need a spreadsheet. A quick look at the historical trap win percentages tells you whether any position carries a built-in advantage or disadvantage tonight. If trap 1 is heavily favoured, any dog drawn there starts with a structural edge before you consider its form.
Step three: scan the form lines, but do it intelligently. Look for trends rather than individual results. Identify which dogs are improving, which are consistent, and which are on a downward path. Cross-reference form with the trap draw from previous races — a dog with middling form from unfavourable draws may be better than it looks.
Step four: compare sectional times. If the data is available, check which dogs have the fastest early splits. In most greyhound races, particularly over standard distances, early pace correlates strongly with winning. A dog with the quickest first-bend split, drawn in a low trap, and showing improving form is a convergence of three positive signals.
Step five: read the run comments and check for excuses. A dog that was hampered, slow away, or boxed in on its last run may have a legitimate reason for a poor finishing position. If the racecard suggests interference or bad luck rather than a genuine decline, the dog’s price may overstate the risk.
This entire process should take you no longer than a couple of minutes once you are familiar with where the information sits on the card. The point is not to agonise over every detail — it is to arrive at a quick, evidence-based view that is significantly better than backing a name, a trap colour, or a price that looks appealing.
What the Racecard Doesn’t Tell You — And Where to Look
No racecard shows you kennel confidence, late market moves, or the dog that trialled brilliantly on Monday morning. The racecard is a snapshot of historical data — it captures what has happened, not what is about to happen. That gap between recorded form and current reality is where additional research pays off, and where experienced greyhound punters separate themselves from the field.
Market movements in the final minutes before a race can signal information that is not on the card. A dog drifting from 3/1 to 5/1 in the last two minutes of trading might be carrying a rumoured niggle. A dog shortening from 7/2 to 2/1 could be attracting informed money from connections who have seen it trial well. These moves are visible on live odds platforms and through bookmaker streaming services, but they require you to be watching in real time rather than placing your bet an hour before the race and walking away.
Trainer patterns are another off-card factor. Some kennels peak dogs for specific meetings or specific grades. A trainer with a 30% strike rate at Hove but a 12% strike rate at Sunderland is telling you something about track preference, travel distance, or both. Timeform publishes trainer statistics that can be filtered by track, and while the sample sizes are sometimes small, consistent patterns over 50 or more runners are worth noting.
Track conditions are the third invisible variable. Greyhound tracks do not publish a going report the way horse racing does, but conditions change with the weather. A rain-soaked track runs differently from a dry one, and dogs that handle soft going may outperform their form on a wet evening. If you are watching from home, live streaming often gives you a visual read on the track surface before the first race — look at how the dogs move through the bends in the early races and compare their times to the published best times at that distance.
The racecard gives you the foundation. Everything beyond it — market intelligence, trainer trends, track conditions, trial reports — adds the layers. You do not need all of them for every bet. But knowing they exist, and knowing where to find them, gives you options that most bettors never consider.
Get more form guides at greyhoundmeetings.
Also read our greyhound form guide.